Animal research statistics
British law protects vertebrate animals such as mammals, fish, and birds used in scientific and medical research. The number of procedures on these animals is counted by the Government every year.
Under the Animals (Scientific Procedures) Act 1986, every regulated procedure on a ‘protected animal’ carried out in Great Britain must be counted - this includes, all vertebrate species (except those in the first half of foetal, larval, embryonic stage) and cephalopods (e.g. octopuses, squid and cuttlefish). These figures are published annually in an annual report by the Home Office. Northern Ireland counts its animal research statistics separately and an annual report is produced by the Department of Health for Northern Ireland.
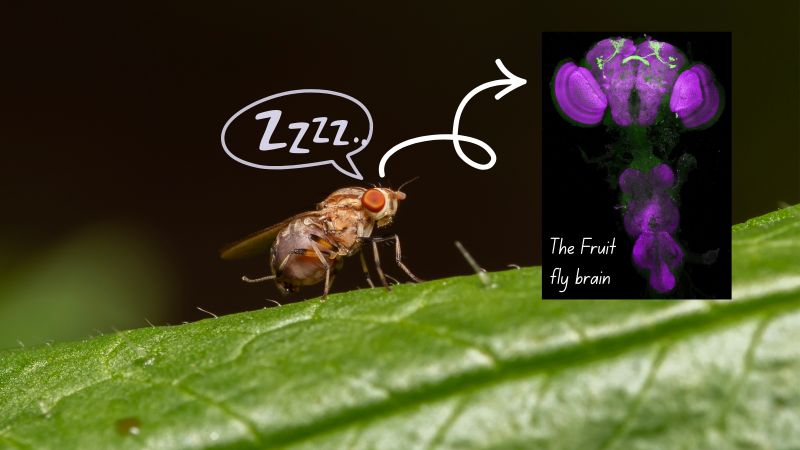
Invertebrate animals such as fruit flies and worms are used in large numbers in research but are not protected by the law or counted.
The annual statistics produced by the Home Office every year are the most comprehensive of any country in the world. They provide information on species, use, genetic status, country of origin, disease areas studied, and much more.
For articles about Great Britain's animals research statistics, including Northern Ireland and the EU, you can view the Animal Statistics tag.
- Number of animals used in Great Britain
- Trends over time
- Not in the annual statistics
- Statistics from Northern Ireland
- International Estimates
Number of animals used in Great Britain
In 2024, the government reported that 2.64 million procedures were carried out in Great Britain, 1.6% less than in 2023. More than half of these procedures were carried out by ten organisations.
Over 95% of procedures were carried out on mice, fish, rats and birds whereas cats, dogs and primates accounted for only 0.2% of all procedures. 79% of procedures caused similar pain (or less) than an injection.
More detailed statistics on animal procedures in Great Britain since 2008
Trends over time
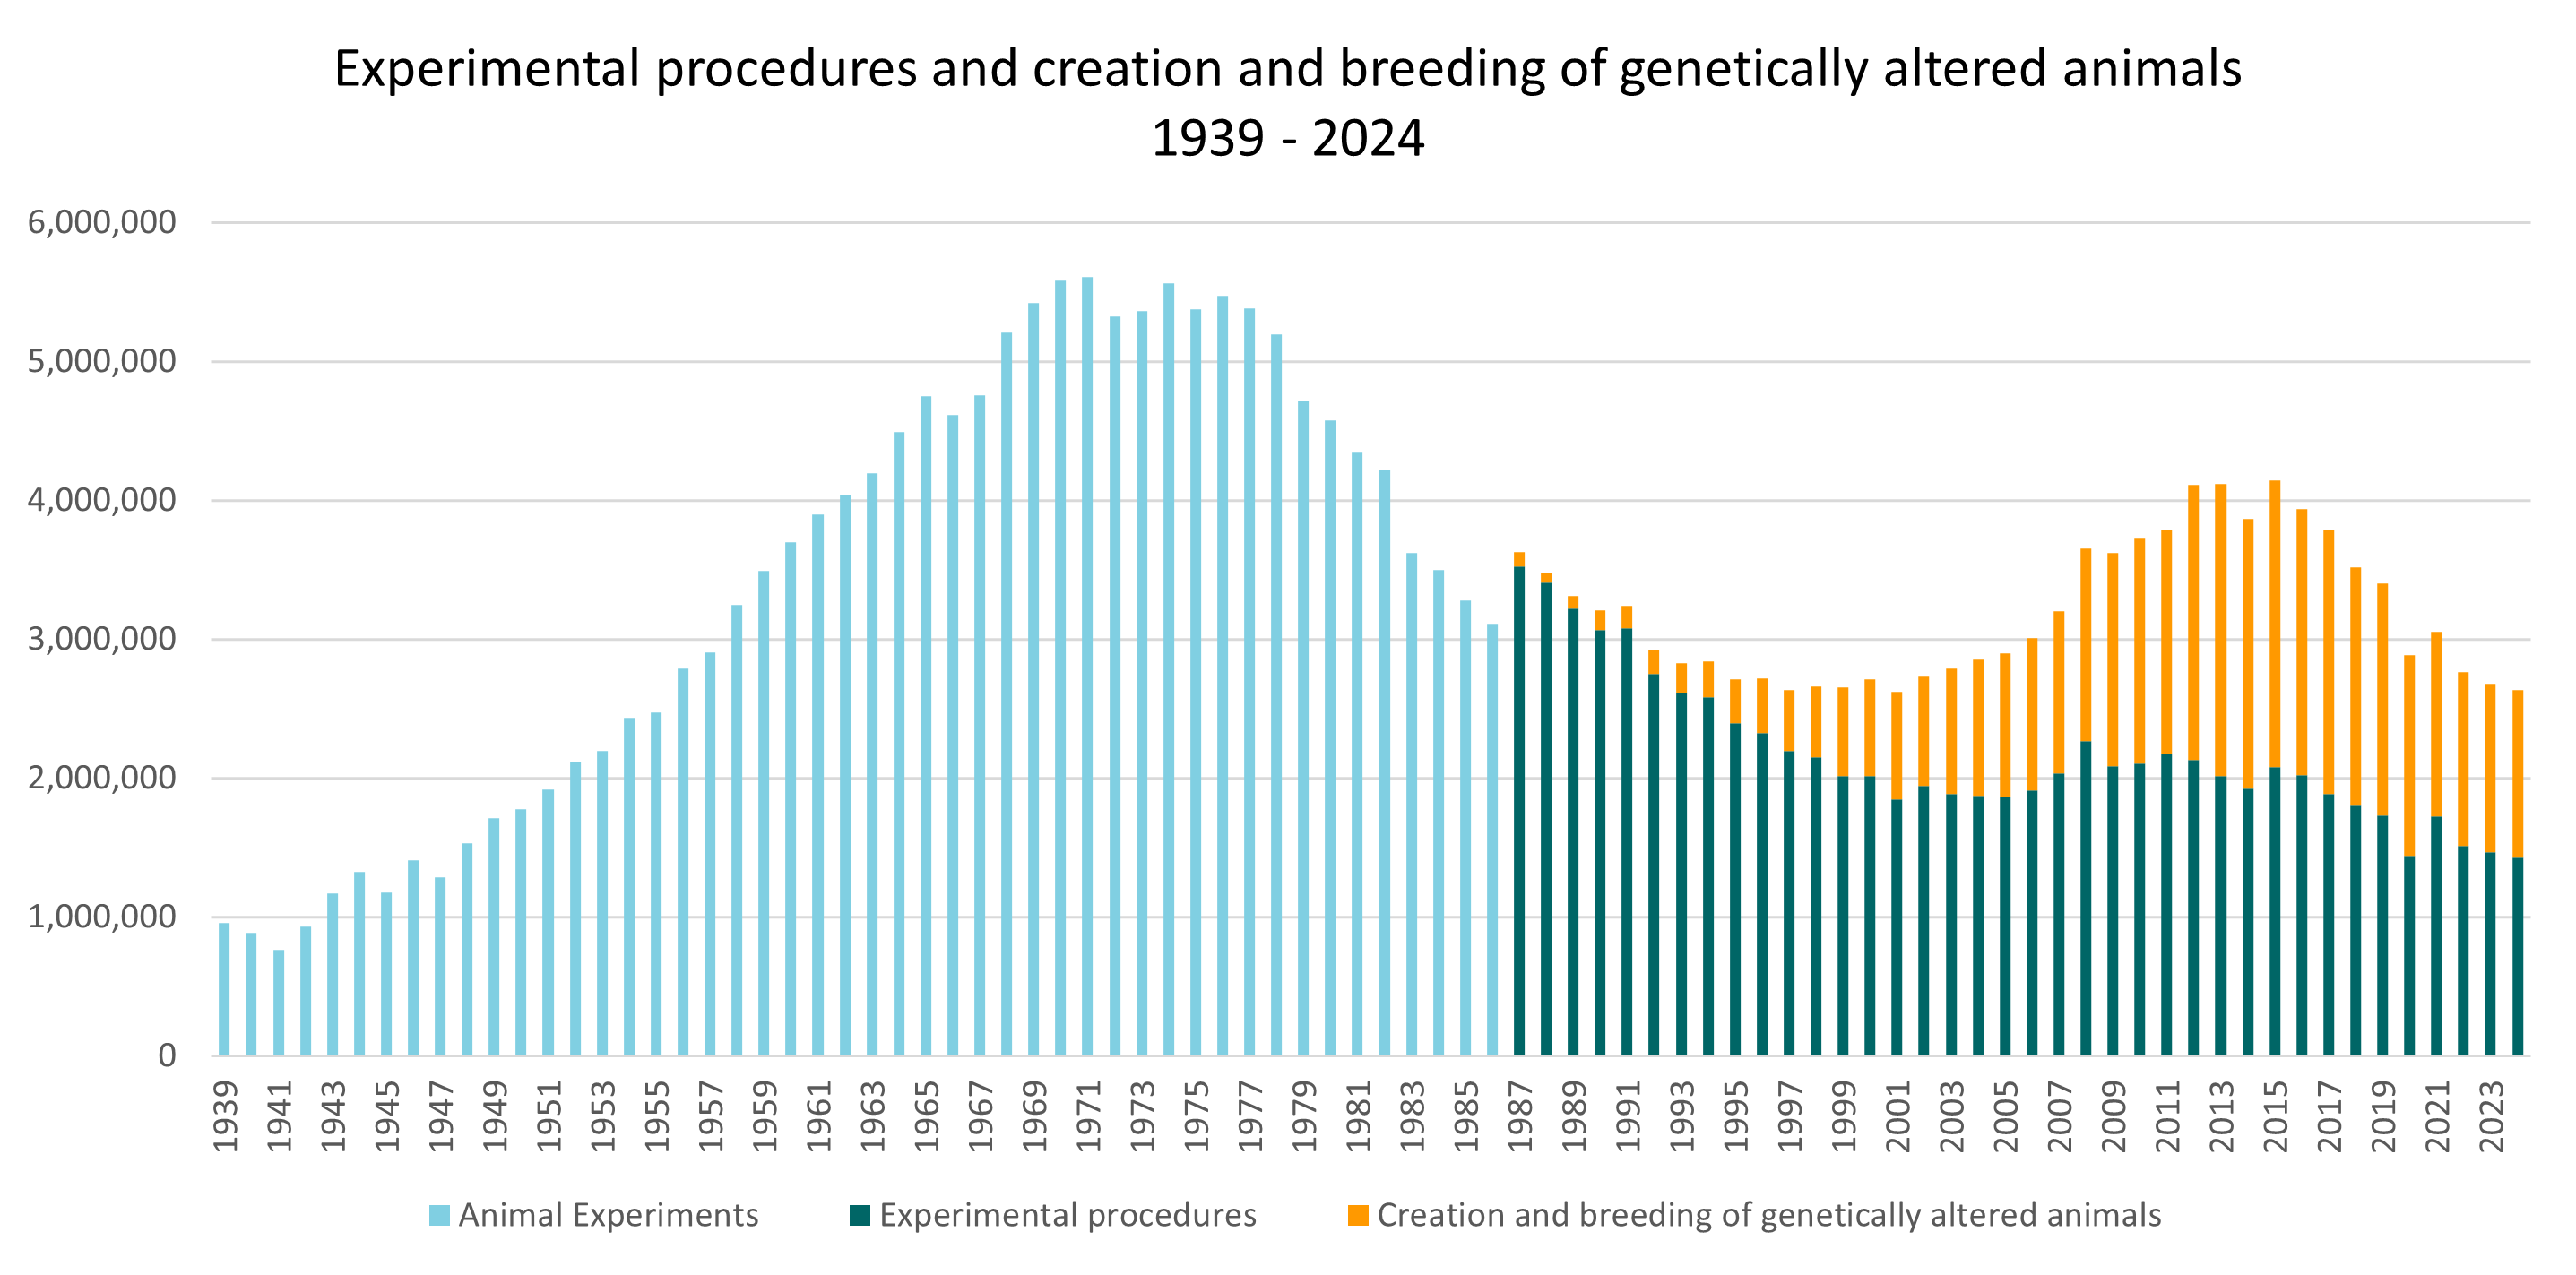
The number of animals used in research grew steadily from 1939 to the mid-1970s, when it peaked at approximately 5.5 million experiments. The numbers then declined steadily until around 2000, at 2.6 million procedures (a slight change to the counting methodology took place from 1987). Since then, the numbers have risen to around 4 million, before levelling off. It is unclear whether this levelling is a permanent state, or whether future numbers will go up or down. The most recent rises in animal procedures appear to mainly be due to the increased production and use of animals with genetic modifications or defects (many fall into the 'breeding' category).
In 2020 the total number of procedures recorded was the lowest they had been since 2004. This was due to various COVID-19 national lockdowns imposing strict limits on daily life and causing many institutions to delay or stop research studies using animals.
The total number of animals used in research is affected by many factors. The overall funding for life sciences in the United Kingdom, as well as the relative funding in other countries, will change the amount of science done – a proportion of which will involve animals.

Download 'Number of procedures on protected animals since 1987'

Download 'Severity of procedures on animals since 2014'

Download '20 years of animal research in Great Britain'
Not in the statistics
Invertebrate animals such as fruit flies and nematode worms are not covered by the Animals (Scientific Procedures) Act, 1986. The reason for their exemption is that there is a lack of evidence that these animals can suffer, particularly in consideration of the different level of complexity of their central nervous system relative to that of vertebrates. The only exception to this is cephalopods (e.g. octopuses, squid and cuttlefish) which were added to the act as a result of EU Directive 2010/63. While the evidence that cephalopods can suffer is mixed, they were added on a ‘benefit of the doubt’ basis. No country in the world counts the invertebrates it uses in research.
Chimpanzees, orang-utans and gorillas have not been used in the UK for over 20 years and their use has been banned since 1986.
Animals that are killed in the research setting without ever having undergone a regulated procedure are not included in the statistics. This includes animals bred for tissue samples, animals bred for research that could not be used, animals used to sustain inbred colonies, and animals used for health screening of other animals in the laboratory. These animals are referred to as “additional” and reporting requirements in EU Directive 2010/63 require that every five years each EU country must submit details of these animals. Details of additional animals were reported for the first time in 2017.
Statistics from Northern Ireland
Animal research in Northern Ireland is monitored by the Department of Health for Northern Ireland.
The most recent report shows that 25,345 procedures were carried out on animals in 2023. Over 93% of the procedures were carried out in mice, fish, rats, and birds, whereas cats and dogs accounted for 0.8% of all procedures in 2023.
While mice are the most common species used (81% of the total), pigs, sheep, and cattle together account for 6.2% of research, reflecting the large amount of agricultural research conducted in Northern Ireland. The 25,345 procedures carried out in Northern Ireland represent approximately 0.9% of animal research across the UK.
International estimates
Trying to estimate the number of animals used in research worldwide is difficult because many countries do not provide comprehensive statistics.
- In 2022, the EU (including Norway) reported that 9,237,542 animals were used in research (8,477,845 procedures for experimental purposes). 92% of animals used for experimental purposes were mice, fish, rats, and birds, while cats, dogs and primates accounted for 0.2%.
- The US only counts mammals (although mice and rats are not included). In 2019 the USDA reported that 797,546 animals (not procedures, as in the UK) had been used in research. Unofficial estimates that include mice, rats and non-mammal vertebrates suggest 12-24 million animals.
- In Canada, the Canadian Council on Animal Care (CCAC) reported that 5,067,778 animals were used in 2020. However, not every Canadian institution belongs to the CCAC, so the true figure is probably slightly higher.
- Australia used an estimated 10.7 million animals in 2018, however official figures are only available for four states/territories; estimates for the remaining four are based on historical averages.
- New Zealand reported that 309,872 animals were used in 2021.
- Other countries that report animal research statistics include Switzerland (556,107 animals in 2020), Israel (402,412 animals in 2019), and South Korea (4,141,433 animals in 2020).
- For more information on international animal research statistics, visit Speaking of Research.